


Interactive market charts designed to provide clarity and insight for sound investment strategy.
At Simplified Financial Frontier, we believe that clarity and insight form the foundation of sound investment strategy. Our interactive market charts are designed to provide you with precisely that.
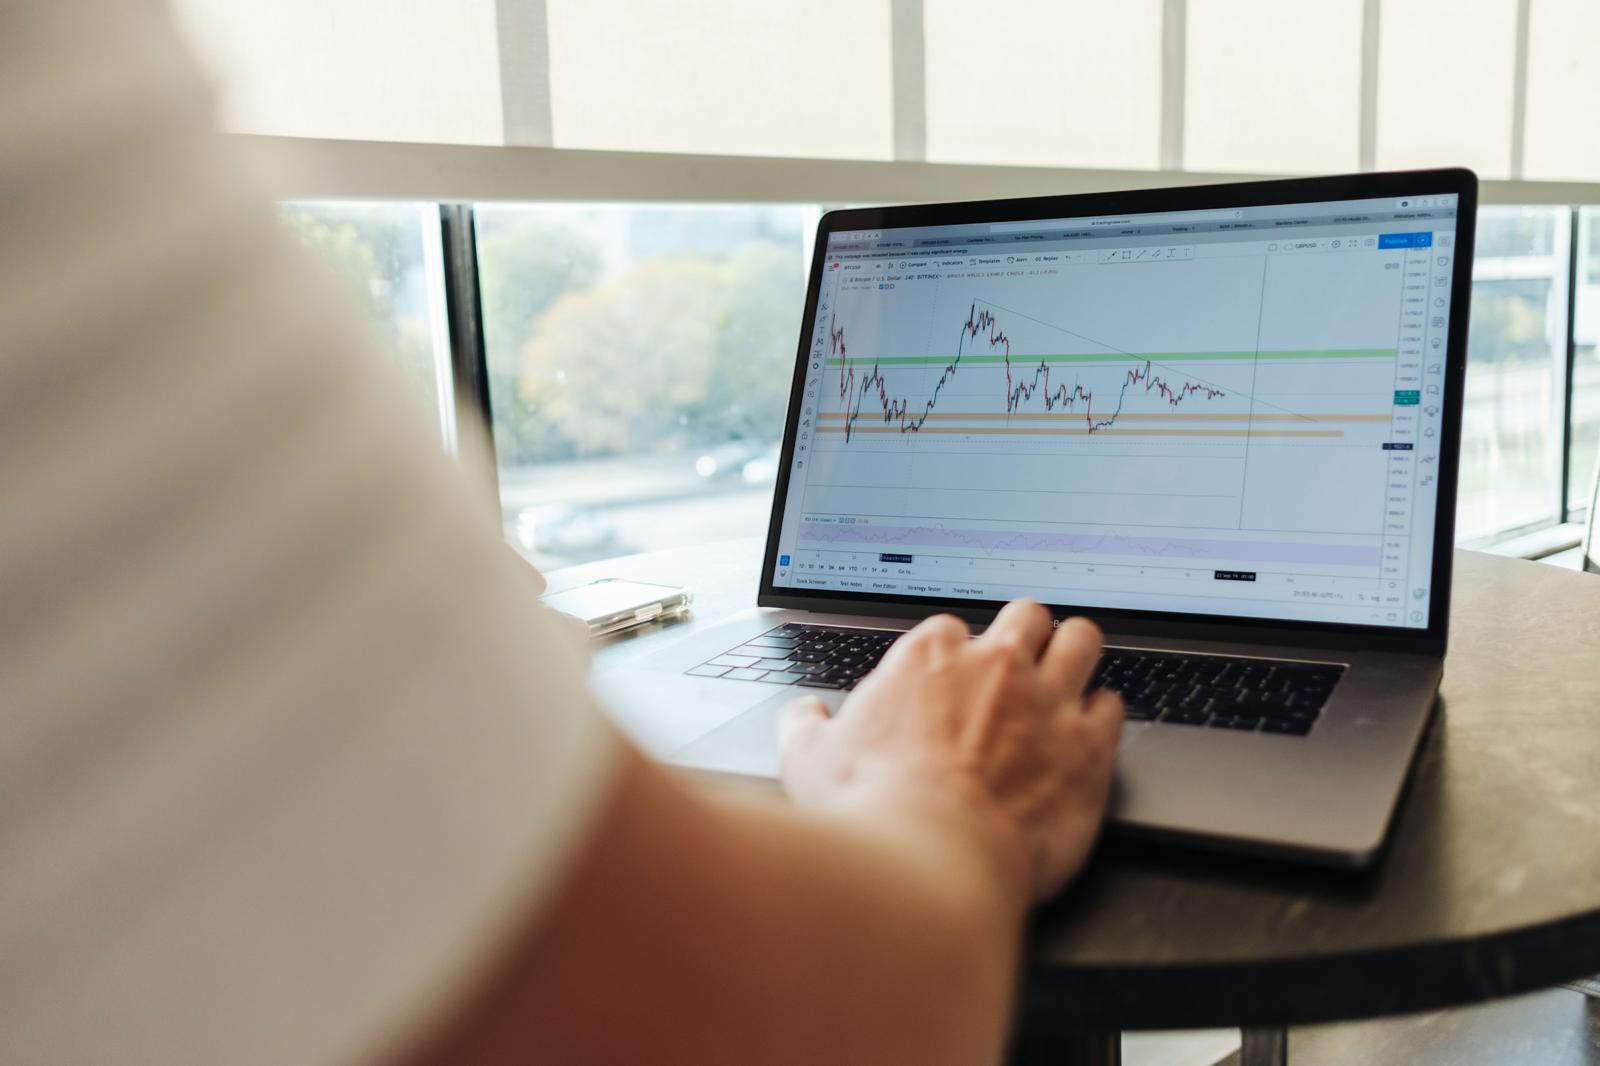
These sophisticated tools offer a clear, comprehensive view of market dynamics, asset performance, and economic trends. We present complex data through intuitive visualizations—including real-time pricing, historical trend analysis, and customizable technical indicators—all within a secure, professional platform.
Real-time data across stocks, indices, currencies, and commodities
Our charts are a window into the markets, engineered to help you and your advisor identify opportunities, assess risk, and make informed decisions aligned with your long-term objectives.
Access live market data with minimal delay, ensuring you're always viewing the most current price action across all asset classes.
Explore price history across multiple timeframes—from intraday movements to multi-year trends—to understand market patterns.
Customize your view with moving averages, volume analysis, and other technical tools to enhance your market analysis.
Compare performance across different markets simultaneously
By transforming raw data into actionable intelligence, we empower you to navigate the financial landscape with confidence.
Explore the markets with precision. Navigate your future with insight.
Simplified Financial Frontier — Illuminating the Path to Prosperity.
Partner with Simplified Financial Frontier for precision investing across global markets.
Get Started Today